Football Transfers infographic
Frank Lampard to Manchester United? Wesley Sneijder to QPR? Lionel Messi to Macclesfield Town?
The football transfer market rumour mill has already gone into overdrive in the media (OK, I made up the last one), but a new interactive tool is treating football fans to transfer data in one place.
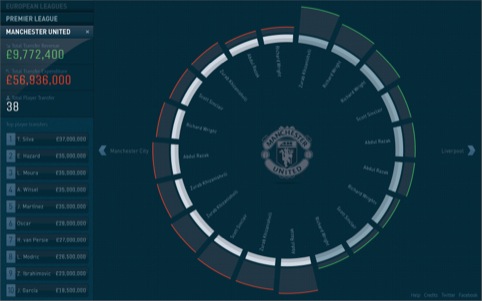
The Football Transfers infographic, from consultancy Signal Noise, maps footballers to and from destinations in the Premier League, Championship and Football League as clubs race to sign players before the transfer window closes on January 31. Updated every morning, it covers transfer signings dating back to the beginning of the 2012/13 season, and calculates money spent between clubs over the course of the year.
The online tool, which uses data from German football website Transfermarkt, also covers five of Europe’s top leagues, including Spain’s La Liga, and illustrates the diverse spending habits of teams looking to win top leagues, or just stay in them.
Hem Patel, partner at Signal Noise, says, ‘It’s not only interesting to see the money changing hands, but also the pace and volume of the transfers that are occurring.’
The firm built the infographic over five weeks as a self-initiated project.
Signal Noise’s infographic can be found at http://transferwindow.info/
Read this next

-
Post a comment


