Olympics data visualisation shows real-time popularity
It’s safe to say that the country has been buoyed by the Olympics, but with no real barometer, there’s nothing tangible to show us this definitively.
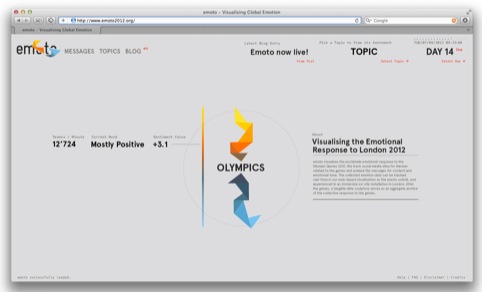
However a data visualisation project, Emoto, has attempted to do just this; to show us how the online community is responding to the Olympic and Paralympic games.
Emoto has been created by Future Everything festival founder Drew Hemment, interface designer Moritz Stefaner and Berlin-based consultancy Studio Nand.
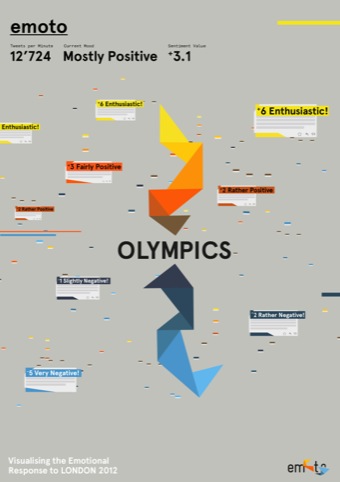
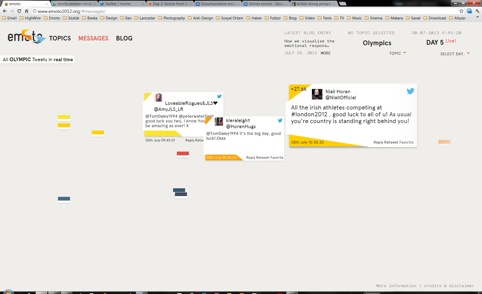
By aggregating social media feeds in real time, Emoto will visualise these sentiments, showing which events are creating the biggest reactions by analysing content and emotional tone.
Head to www.emoto2012.org to find the infographic, where orange is positive and blue is negative.
If that’s not tangible enough, for the Paralympics, research and technology group Sensible City Lab, has created an installation for London’s Trafalgar Square, which will use the data to create an immersive 48-channel sensory experience. You can see the installation from 29 August-9 September.
Different countries are represented by particular sounds, which will be played louder depending on the positivity of online discussion about them.
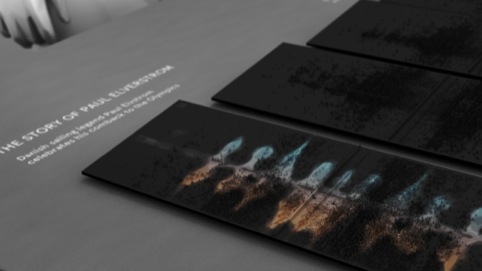
In a separate effort, all of the Olympics data will be pooled to form a 3D artwork – or ‘relief landscape’ – which is to be milled onto 19 plates – one showing the reaction to each day of competition.
Read this next


Great design, colours, fonts etc, wish this had been used throughout for the official branding.