
How service design can promote an “open science” solution for virus outbreaks
Nextstrain is a platform designed to facilitate the sharing of genomic data – here, Design Week speaks with two of its researchers about how it is tackling the coronavirus outbreak.
The viral outbreak of COVID-19 – otherwise known as coronavirus – that began in China some two months ago has so far infected more than 80,000 people globally, and killed more than 2,700.
It has, in recent weeks, gained a foothold in across Europe, the Middle East, North America and Asia.
As the World Health Organisation (WHO) warns that many countries are “simply not ready” for a pandemic, scientists and public health officials are scrambling to retrieve data on the virus that can inform their outbreak response.
At a rate not seen before, this is increasingly being done through “open science”, and a worldwide collaborative platform between scientists is championing this approach. Based dually between Basel and Seattle, Nextstrain is a platform designed to facilitate open data sharing and up to date (to the hour) data visualisations.
Informing public health decisions
Originally conceptualised as Nextflu, the platform was established some time between Christmas 2014 and early January 2015 by biologist and physicist Richard Neher and infectious disease researcher Trevor Bedford. Back then, it was designed to track seasonal influenza infection around the world.
It has since branched out to a number of different pathogens, covering the likes of West African Ebola, Zika and even measles, uniting all research all under the more general name Nextstrain.
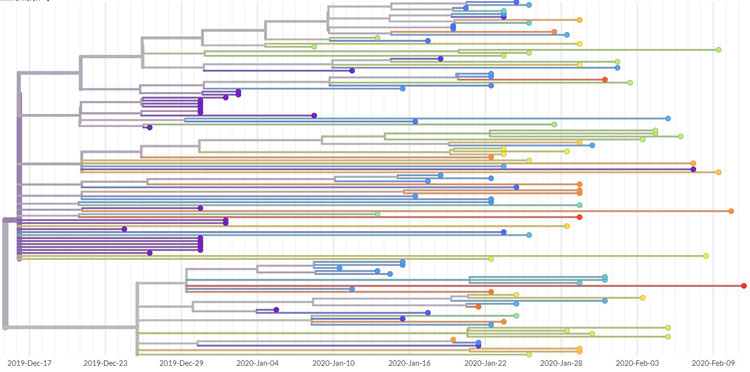
The philosophy behind the platform centres around the value of pathogen genome sequencing data in making public health decisions. By reconstructing a phylogeny – the evolution of, in this case, a virus – important information can be learned, such as a virus’ spatial spread, introduction and growth rate.
If this information is to inform public health decisions – such as the border closures, event cancellations and quarantines seen so far during the coronavirus outbreak – Nextstrain believes these analyses must be carried out rapidly and concurrently and their results shared widely and in a timely manner.

“People can see the benefit of early data sharing”
The traditional way for scientists to share data, however, is through peer-reviewed journals. While this method has been custom for hundreds of years, in the face of a potential global pandemic, it is slow and costly.
This was the inspiration behind the establishing of the open science platform. Instead, scientists upload their data to GISAID, the Global Initiative on Sharing All Influenza Data, where it is collected, curated and stored. This allows platforms like Nextstrain to access and use the data for analyses.
According to James Hadfield, a researcher, programmer and data visualiser at Nextstrain, open science is a movement that has been catching on for some time. As new technologies and practices have developed and sequencing has become cheaper and less error prone, he says traditional publication systems are being rethought.
“We can’t expect that overnight the whole publication model, which has served science really well, will just disappear in a puff of logic,” says Hadfield. “But slowly over time, we are seeing change and I think that change is brought about by examples like coronavirus, where people can really see the benefit of early data sharing.”
Visualisations that can be interpreted by all
Alongside the datasets provided by an international community of scientists, which are put online and made available for anyone to study and investigate, the Nextstrain team works to visualise the information. This is done both to identify patterns in the data and make it easier to communicate to a wide range of people.
“We wanted to design visualisations that were scientifically very valid, but interpretable by people who maybe don’t have formal training in genomics, epidemiology or outbreaks, but work in public health arenas,” says Hadfield.
With such a wide range in audience, the design of these visualisations is crucial according to Emma Hodcroft, a phylogenetic researcher and programmer at Nextstrain.
“What we can show to other people with the same background as us, and how they will interpret it is one thing,” Hodcroft says. “But how we display this for people who aren’t in our field is something we have to think about more carefully, especially when you’re getting a lot of views from people without an expert background.”
In particular, she says, the team are working on ways they can visually convey a sense of uncertainty.
“Finding a way of displaying that something isn’t certain is something that, if you work mostly in a tight community of sciences, can be easy to slip your mind,” she says. “How will [our work] come across to the greater public, and what can we do to prevent accidentally spreading misinformation?”

Avoiding a “black box” approach
Open data sharing can, however, be a daunting prospect for some scientists. The worry for many is that their teams will not get the recognition for the work they have done if they don’t go through formal publication channels.
In this way, the Nextstrain service has been designed to foster both community and a sense of ownership among its contributors. Much like its open science approach to data, the mechanics of the site, including the visualisations, are all open source.
“All of the code for Nextstrain is open source [available through GitHub] and people can work on it and suggest changes,” says Hodcroft. This is an important part of the service design, she says, because it prevents the platform from appearing like “a black box”.
“[We need to] reassure people and give them an idea of what’s happening to their work,” she adds. “Scientists can see the assumptions we’re making and what is happening to their data, and because of that, they’re in complete control of it.”

Fostering the community for the future
In Nextstrain’s coverage of the coronavirus so far, all of the sequencing data has been gathered by its community, with much of this done by scientists in China.
It is, according to Hodcroft, the largest and most widespread coverage that the platform has led to date, with the team aiming to get the latest information live within the hour of it being released. And with a team and wider community spread across different time zones Nextstrain can be updated 24 hours a day.
“Outbreaks are not confined to one place,” says Hadfield. “The more people that can be involved, the better the response and the data we can present.”
Hadfield ends: “Truly this whole platform would not be possible without data generators freely sharing their work in a timely manner.”

-
Post a comment


