What does the design industry look like?
As part of Design Week’s careers and salary survey, we look at the make-up of the design industry – who are you, how long have you been in your job… and are you happy?
At the end of last year we asked our readers to help us compile a career and salary survey of the design industry, to find out who makes up the industry and how much they get paid.
More than 2,000 of you responded and the results have been analysed and visualised by IIB Studio.
In this article we look at what the results tell us about who designers are, what jobs you do and whether or not you are happy…

Taking results from both Design Week and Creative Review readers, which includes advertising creatives, the results show that more than half of you specialise in graphic design. Branding and print design are also popular specialisms, followed by digital and advertising.
Taking designers in isolation, 19% of you said you specialise in editorial design and 19% in packaging design.
Looking at other sectors, 15% of you said you specialise in exhibition design, 14% in interiors, 14% in retail design and 5% in furniture design.

The survey also revealed an industry that is predominantly male and overwhelmingly white.
Our findings were similar to the recent GraphicDesign& survey of graphic designers, which showed that 54% of respondents were male and 85% were white.

In terms of experience, on average you have worked for eight years in the design and creative industries – although more than a third of you have worked in the sector for more than ten years.
The average length of time spent in your current role is four-and-a-half years, but nearly one in three of you had been in your job for less than a year.
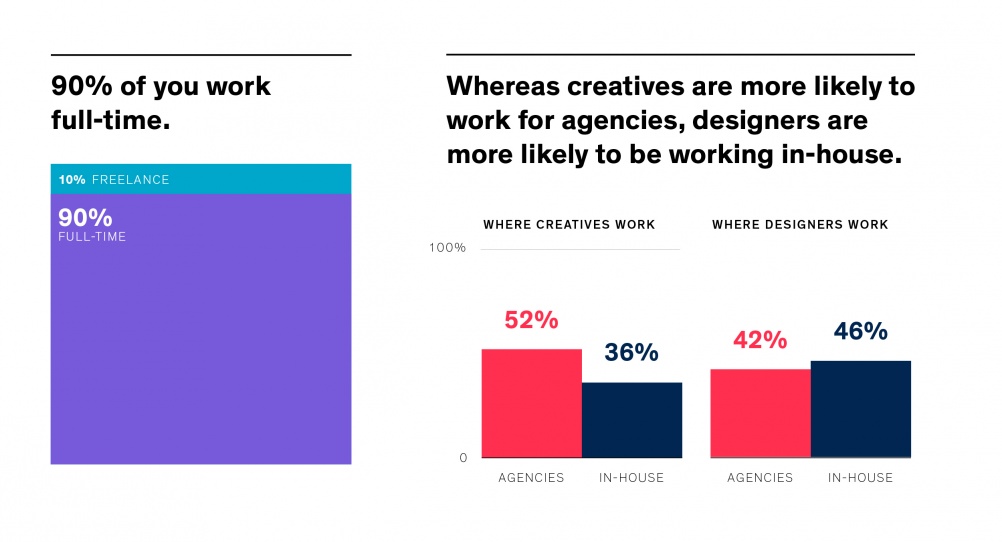
The freelance sector is, perhaps surprisingly, small – with only 10% of respondents saying they work freelance.
The agency/in-house split differs between the design and the advertising creative sectors. Slightly more designers work in-house, rather than at agencies, while in the advertising world it is more common to work in an agency, with just 36% working in-house.
Of those designers who said they work for consultancies, 86% work for independent businesses while 14% work for networked agencies.
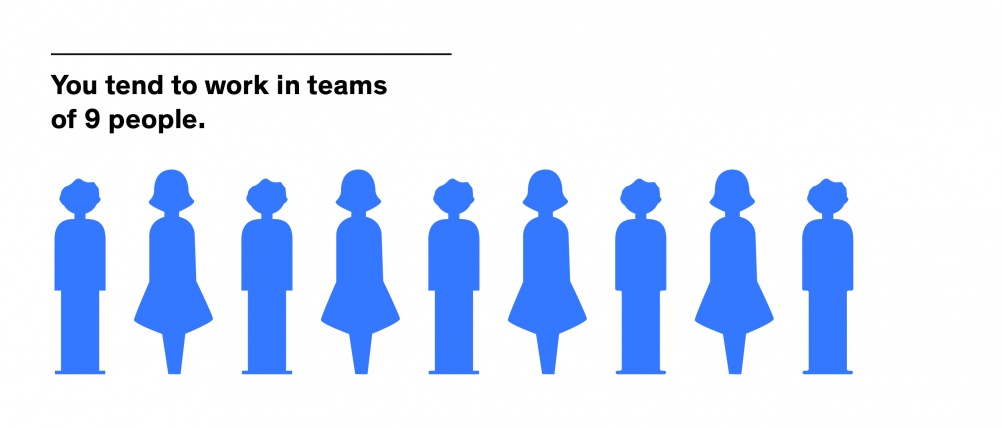
The average number of teams is nine people. This could refer either to the size of a design consultancy in its entirety or the size of a design team within a larger organisation.
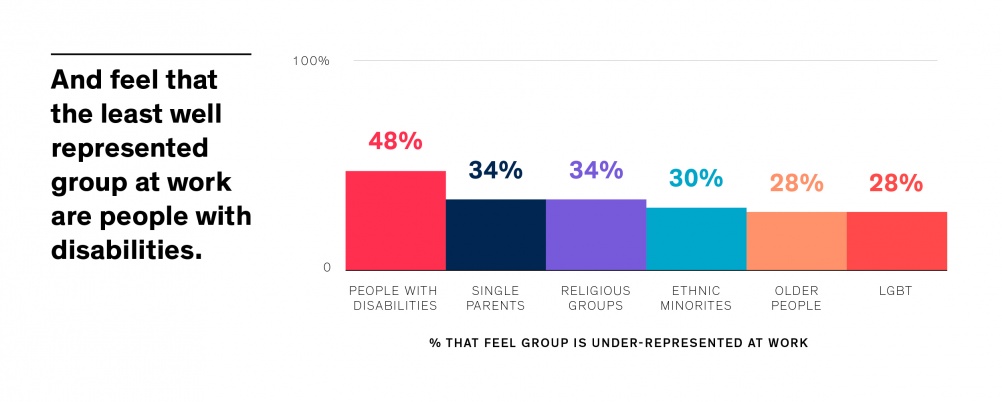
Nearly half of you feel that people with disabilities are the least well-represented group in the industry, with single parents, religious groups, people from ethnic minorities, older people and LGBT people also felt to be under-represented.
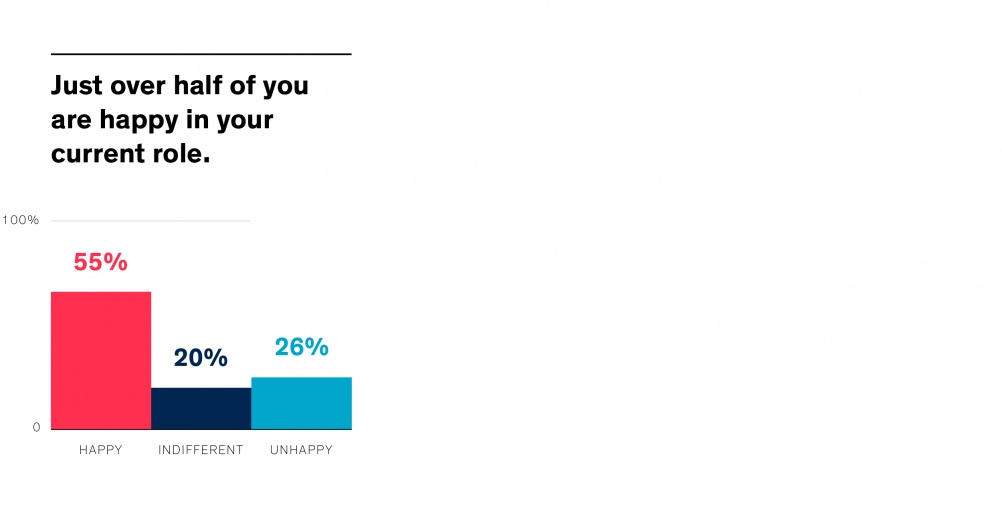
And – a key point here – just over half you said you are happy in your current role.
Jump to our next stories to find out about more about your salaries and working lives – and the things that make you happy or unhappy at work.
Visit the 2016 Design Week Careers Survey homepage
We asked data visualisation specialists IIB Studio to help us uncover and visualise the stories in our survey. IIB Studio took the data relating to designers and creatives and analysed them, looking for the most interesting relationships, patterns and conclusions that could be drawn. They then turned these findings into the visualisations you see here.
Our thanks to Ella Hollowood, Michael Brenner, Duncan Swain and Rebecca Conroy. For more on IIB Studio’s work, go to iibstudio.com.
Read this next

-
Post a comment


