The Design Week Top 100 2013
Download the full Design Week Top 100 2013 ranking here.
The design industry and the wider economy may have changed significantly since we last ran a Top 100 consultancies survey in 2011, but there is one major theme that seems to remain – some very impressive growth figures across all design sectors.
The consultancies returning to the Top 100 – of which there were 63 – posted an average fee income growth of 30 per cent over the two years. This is boosted by some spectacular individual results. Design Bridge, Pearlfisher, 20.20 and Taxi Studio all saw fee-income grow by more than 100 per cent in the period, while packaging specialist Equator Design saw a jaw-dropping 294 per cent growth, taking it to number 12 in the table up from 64.
Equator’s growth is due to a merger in May 2012 with Manchester-based GJ Creative, to form a specialist packaging company under the Equator banner. The unified company, which has offices in the UK, Ireland, the USA and Australia, counts Aldi, The Co-operative Group and Morrisons among its clients.
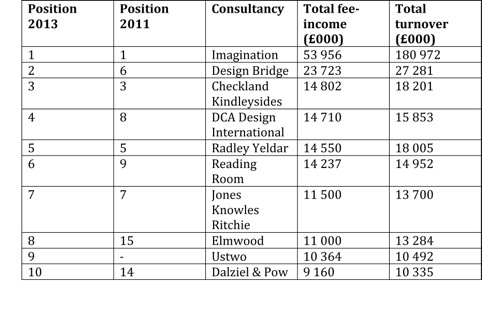
Other impressive moves see Design Bridge rise from sixth to second spot in the table, behind perennial chart-toppers Imagination. Elmwood breaks into the top 10 this year at eight up from 15, with a 96 per cent rise in fee-income.
And there are also some impressive debuts this year – notably digital design studio Ustwo, which has offices in London, New York and Malmö in Sweden, and makes ninth spot in the chart, with a fee-income of £10.4m.
Fellow digital specialist Poke lands at 17th place in the chart with an impressive fee-income of £6.7m. These two consultancies are exemplars of the vibrant digital sector, which has seen several big-money acquisitions in the past 12 months, most notably the £350m buy-out of AKQA by WPP, and Publicis Groupe’s £332m deal to buy LBi.
As well as digital, branded packaging emerges as a lucrative sector, represented in the Top 10 by Design Bridge, Jones Knowles Ritchie and Elmwood.
DCA Design, at fourth place, represents the product sector, while Radley Yeldar – notable for its work for central Government, as well as private clients – represents corporate communications in fifth spot.
Outside the top ten, however, there are some examples of two years of transition. The Team, which saw a 31 per cent drop in fee-income in 2011, has continued this trend – although the 36 per cent drop over two years should indicate a levelling off as the consultancy, which previously relied on public sector work, aims to recalibrate as a digitally focused business.
Meanwhile, Derbyshire-based RJ Design Associates has posted a 34 per cent drop in fee income, and Redhouse Lane is down by 52 per cent, although both still report respectable fee incomes of £1.8 million and £1.6 million respectively.
There are some noticeable absences from this year’s chart, which are indicative of the changing nature of the design sector. Both Navyblue and 300 Million, who ranked at 41 and 80 in the 2011 chart respectively, have since gone out of business.
300 Million, which closed at the beginning of 2012, put the move down to the loss of a significant client, while another client was in debt and unable to meet its obligations. Navyblue, which went into liquidation in September 2011, cited economic and trading pressures as well as internal problems.
Both examples prove that alongside the good news stories at the top of the table, the situation in the design industry remains precarious, particularly for consultancies relying on clients to meet their financial obligations.
A series of mergers and acquisitions over the past couple of years have also seen several consultancies remove themselves from the charts.
Unlike independent groups, consultancies owned by multinational networks such as Omnicom and Havas are unable to present figures that haven’t undergone a full audit.
WPP-owned consultancies – which obviously now include AKQA, second placed in the 2011 chart – are also still subject to this legislation, despite the parent company having moved its tax base back to the UK.
Figtree, which made the 36th spot in the 2011 chart, was acquired by US consultancy Prophet at the end of last year, and so decided not to enter this year. Start JG, which was fourth in 2011, also declined to enter.
In their place, we welcome a number of new arrivals, including Conran in 30th place and Music at 72.
Manchester-based consultancy Music is one of several groups to have made both the Top 100 chart and the Creative Survey Top 50. The Chase, Elmwood, Purpose, Tayburn, Poke, Love, Imagination and Pearlfisher are the other groups showing that creativity and business excellence don’t need to be mutually exclusive.
The Financial performance of the Top 100 – by Kingston Smith W1’s Esther Carder

The make-up of the 2013 Top 100 is quite different to when it was last put together in 2011. There are 37 new entrants. This will be due to some agencies, which have grown enough in the past couple of years to displace other entrants and others that have not entered this year.
All the agencies at position 90 and below are new entrants. Further up the chart some of the most notable new entrants this year are Ustwo at nine, BWP Group at 13 and Poke at 17.
This year’s Top 100 generated fee-income of £424 million, which is an increase from 2011 of 2.3 per cent. However, this is not a fair comparison because two years have elapsed since the last survey, which means that a much higher proportion of the agencies featured in the table are different.
Therefore, if we look at the 63 agencies that appear in both surveys, then the growth in fee-income over the past two years has been 30 per cent. If we assume that growth occurred evenly during both 2011 and 2012, that gives us a 14 per cent growth in income for each year. Interestingly, this is exactly the same level of average fee growth that we saw from 2010 to 2011.So, despite the overall flavour of the times continuing to be tough, agencies are still managing double digit growth, which is very encouraging.
Quite a lot of this growth has occurred at the two top slots, with Imagination and Design Bridge, which account for an increase in income of £27m between them alone. If the growth at these two agencies is stripped out, however, there is still an average growth year-on-year of 12.5 per cent.
The largest percentage increase in fees was seen at Equator, with a whopping 294 per cent. However, in May 2012 Equator merged with GJ Creative, which helped to boost its income. Other achievements are Taxi Studio with a 194 per cent increase, Pearlfisher with 123 per cent and Design Bridge with 121 per cent. All this impressive growth saw these agencies leap up the rankings – Equator moved from number 64 to 12.
Despite the majority of successes, there have also been some large decreases in fee-income. Just 13 of the 63 comparable agencies saw income fall in 2013 compared to 2011, and this reduction was fairly well spread between the larger and smaller agencies. However, the number experiencing decreases seems to get lower each year, which is encouraging. Redhouse Lane (52 per cent) and The Team (36 per cent) had the greatest falls in income. The Team’s decrease follows a 31 per cent decrease between 2010 and 2011 – a disappointing outcome for them.
Looking at the relative size of each discipline within the Top 100 provides an insight into the strength of different disciplines. Digital design still has the largest market share with 24.8 per cent – similar to the 26 per cent previously reported. Packaging remains a close second with 23.8 per cent market share, up slightly from 20 per cent. Branding is third at 16.5 per cent and print fourth at 13.8 per cent.
The efficiency of the design groups can be measured by looking at the fee income per head. Ideally, designers should be aiming to achieve between £80k and £100k per head. The average for this year’s Top 100 is £76k, which is a decrease on 2011’s £79k. It is disappointing that this ratio remains outside our target ratio and has fallen.
Of the Top 100 agencies, 35 managed gross income per head either within or in excess of our range. Of these, 13 had fee-income in excess of £100k – the same as the previous survey, which proves that our target is more than acheivable. Checkland Kindleysides remains the most efficient agency, with 85 members of staff generating fee-income per head of £174k. This was slightly less than the previous survey’s £181k because of a slightly reduced income, but the agency keeping staff numbers at the same level. Blue Goose remains second with a fee-income per head of £170k. This is a huge increase on last survey’s £148k, which was achieved by increasing income by 30 per cent but staff numbers by less.
Nine agencies reported fee-income per head of below £50k (ten in the previous survey). The smallest is Populous Activate, with a fee-income per head of £28k. On the whole, the smaller agencies tend to have the lower average fee- income per head.
For those that reported staff numbers:
• Of the 16 agencies with fee-income of less than £1m, only one – Family (and Friends) – managed to achieve our target ratio of at least £80k per head.
• Of the 28 agencies with fee-income of between £1m and £2m, eight managed our target ratio.
• Of the 22 agencies with fee-income of between £2m and £4m, 11 managed our target ratio.
• Of the 20 agencies with fee-income of between £4m and £10m, eight managed our target ratio.
• Of the nine agencies with fee-income of more than £10m, seven managed our target ratio.
Similarly, if we split the sample into four quartiles, from the lowest to the highest quartile three, seven, ten and 15 agencies respectively made the target.
Despite the ongoing economic uncertainty, not one single agency has predicted a decline in projected growth, although a few chose not to opine and so have not been included in the average.
Overall, the average forecast growth was 14 per cent – identical to the actual average growth seen over the past few years. In fact, 19 of the Top 100 are predicting growth in excess of 20 per cent for 2013. However, this figure is a lot less than the 32 in the previous survey. Household Design is predicting the highest growth at 60 per cent. The agency is ranked at 60 in the current Top 100 and this optimism comes off the back of a 20 per cent increase over the past two years.
Encouragingly, despite ongoing difficult times, designers have achieved a healthy increase in fee-income and, if predictions are correct, fee-income should continue to increase across the board at a similar rate. However, the decline in average income per head is disappointing and suggests that agencies are taking on additional staff at a faster rate than additional income. This is likely to be caused by pressure from clients on the level of service expected for the fee they want to pay.
Unfortunately, if designers cannot find a way to push back and demonstrate value for money, then they may find themselves spending more on staff costs to generate the same levels of income. This will, inevitably, put margins under pressure.
Esther Carder is a partner at Kingston Smith W1
CORRECTION: The interiors sector analysis on page 33 of the Design Week Top 100 print supplement incorrectly states that Green Room Retail Design saw a slight decline in interiors income from 2011-2013. However, as the table on the same page shows, the consultancy’s income from interiors projects rose from £2.4 million to £2.8 million in that period.
Read this next


I’ve been toying with the idea how ranking agencies by fee income for a while, recently writing a thought piece about it… would be keen to hear your thoughts… http://buff.ly/1bk9jlD
Greg
http://Strat-Talking.com