EDF visualises Olympic energy use
Applied Works has created a web-based tool for energy supplier EDF, which will monitor and visualise energy use across key London 2012 Olympic sites.
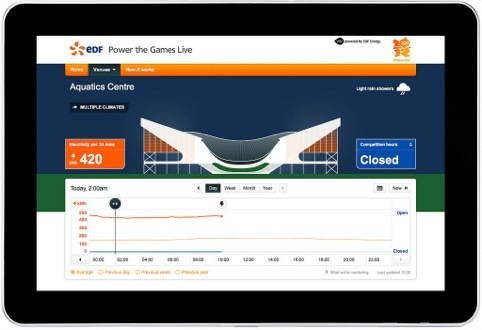
Peter Grundy was enlisted by Applied Works to create visualisations of each of the venues.
EDF, which is supplying energy to Olympics venues, appointed Applied Works directly in April 2011, tasking it with creating an energy visualization.
They developed a tool, Visi, which can demonstrate the benefits of monitoring energy use at The Olympic Stadium, Velodrome, Aquatics Centre, Basketball Arena, Tower Bridge, and the London Eye.
Peter Grundy was brought in to illustrate each of these venues and was chosen ‘for his simple style, which made for an excellent collaboration, as often energy dashboards are very overcomplicated,’ says Applied Works account director and partner Paul Kettle.
Applied Works researched energy demand with the energy mangers of each venue, before creating a tool which shows energy use over a timeline, and can be tracked by Olympic events or external variables including the weather and daylight.
Although Visi has been primarily designed to engage the public on factors that increase energy consumption, and how to optimise energy use, it will be used after the games for future energy managers to monitor stadium energy use.
Read this next

-
Post a comment


